MOE's LigPlot gizMOE rules!!!

I just tried to use MOE (Molecular Operating Environment) to draw a ligand/protein interaction diagram. I fell in love with these kind of graphs the first time I saw them, from the original LigPlot software. I love the way they represent the fundamental interactions without the fuss of 3D structures. I did once suggested the use of them rather than confusing 3D structs as output of a distributed docking program at my previous university. Look at the picture above, and it shows how a given ligand interacts with neighboring residues by means of hydrophobic contacts (the small sun-like drawings) or hydrogen bonds (the green line with distances)
Anyway, right now I just needed a couple of shots showing how the lipocalins' binding pockets are devoid of h-bond anchor points, if compared to other classes. Unfortunately, LigPlot for windows does not come without the hassle of having to mail his author, so I had to wait until I got back to work. Where we have MOE and their own implementation of the cake.
This morning, then, I loaded up three Lipocalins structures, plus one Exopeptidase, one Protease, and one Oxido-Reductase for comparison and hey!, presto, I have six wonderful shots lending weight to my assertion.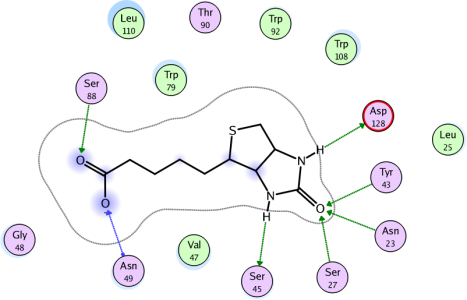
(picture here isnone of them, just a snapshot from MOE's website - again, green lines show h-bonds (without distance, but they have directionality as added bonus) - the green balls are apolar residues in hydrophobic contact.) I am not sure what the blue line is. Oh, there it is: When the hydrogen bond is formed with the residue sidechain, the arrow is drawn in green. Hydrogen bonds to the residue backbone are drawn in blue, with an additional dot drawn at the residue attachment point.
I just wish my current work was more structure-based to be able to play some more with all these cool softwares. Well, may be my next job? or life? who knows?


No comments:
Post a Comment